

Cover image caption: Modern commercial complex managed from one integrated platform.
KEY TAKEAWAY
Odoo building management is a solution on Odoo ERP version 19 that brings leasing, billing, technical operations and board reporting into one application for malls, office buildings, shophouses, boarding houses and apartments, housing estates, and warehouses or industrial estates. Its purpose is to replace scattered Excel files. The board sees occupancy, rent roll, collection rate and GOP/NOI on one screen, tenants use a phone-browser portal, and technical teams work from the field with office verification before any data reaches an invoice. The solution is available in three languages.
For owners and operators of commercial property, Odoo building management answers a simple question: can you see the condition of the entire portfolio today, rather than after the month-end roll-up is finished? In many companies the answer still depends on how quickly staff can merge Excel files from leasing, finance and engineering. This article explains how a single application can serve the board, tenants, technical teams, and the leasing and finance functions, and how senior leaders can judge whether their organisation is ready to move.
Why a pile of spreadsheets is a governance risk, not just an inconvenience
Managing property with many Excel files creates a governance risk because the same numbers are calculated repeatedly in different places and never fully reconcile. Contract data sits in the leasing file, billing in the finance file, meter readings in technicians' notes, and complaints in messaging groups. Each file has a different owner, is updated at a different time, and is rarely cross-checked.
The effect reaches decisions directly. The board receives an occupancy report that differs from the rent roll reported by finance. Arrears become visible only in the monthly roll-up, even though a tenant may be weeks late. A missed rent escalation means revenue that is never billed. A complaint without a deadline turns into a grievance that reaches senior management. All of these problems share one root cause: there is no single source of data that everyone uses.
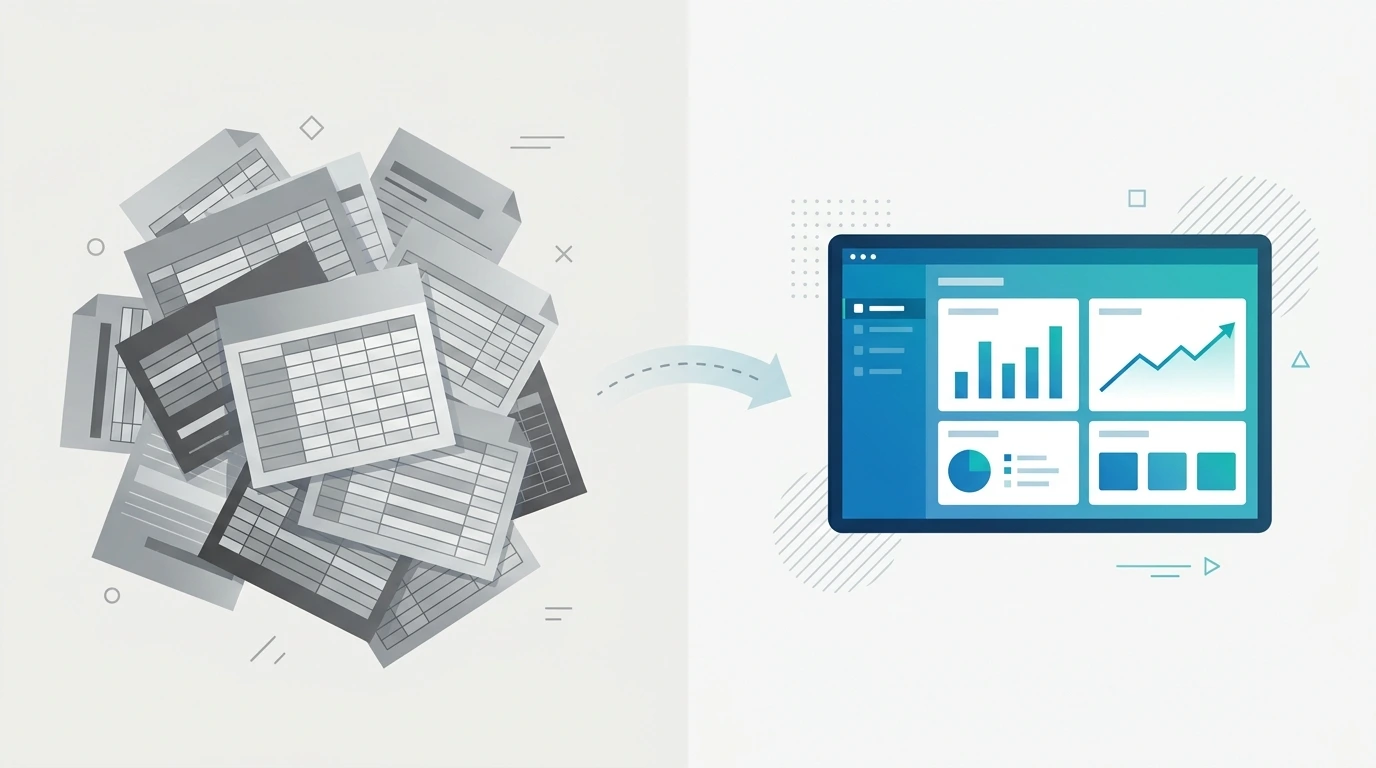
Figure 1. From separate, interdependent files to one source of data shared by every department.
One application for every property type and company structure
The solution is designed so that one application can serve a diverse portfolio: malls, office buildings, shophouses, boarding houses and apartments, housing estates, warehouses and industrial estates, multi-company groups, and property management companies. This range matters because many property groups hold more than one asset type, and running a different system for each type merely moves the spreadsheet problem elsewhere.
At group level, each company can keep separate books, while the board can still view figures per building, per company, or for the entire group. For property management firms, the management fee payable to the manager is handled in the same system. Legal separation of entities therefore no longer means separation of visibility for leadership.
For the board: an executive dashboard that answers the key questions on one screen
The executive dashboard shows the indicators that most determine property value on a single screen, so the board does not have to wait for manually compiled reports. The main indicators are occupancy, rent roll, WALE (weighted average lease expiry, the weighted average remaining lease term) and vacancy cost. Together they answer the core questions of an asset owner: how full the building is, how much rental income is contracted, how long that income is secured, and how much is lost to empty space.
On the financial side, the system compares revenue, operating costs, GOP and NOI against budget. GOP (gross operating profit) and NOI (net operating income) are the measures of operating profit commonly used by property investors. Collection rate and receivables ageing make arrears visible immediately, without waiting for the month-end summary. Board access is view-only, accompanied by a list of items that need attention first, so leadership focus goes to what is urgent.
| Indicator | Question answered | Action triggered |
|---|---|---|
| Occupancy and vacancy cost | How much space is let, and how much value is lost on empty space? | Leasing priorities and adjustments to the offer strategy |
| Rent roll and WALE | How much rental income is contracted, and for how long? | Renewal planning for leases nearing expiry |
| GOP/NOI vs budget | Is operating performance on plan? | Tracing cost lines that exceed budget |
| Collection rate and receivables ageing | Who is in arrears, and for how long? | Staged collection up to formal warning letters |
For tenants: a phone portal that reduces the burden on the management team
The tenant portal runs in a phone browser and requires no additional licence, so tenants can use it immediately without installing anything. Inside it, tenants see their own contract, billing components, invoices and deposit. This transparency reduces the repetitive questions to the finance team that usually consume staff time.
The portal is also a two-way data channel. Tenants on a turnover rent scheme, where part of the rent depends on sales, submit monthly sales directly to the system. Tenants also submit meter readings, report complaints, and then follow the ticket. Every complaint carries a service-level deadline (SLA) and a person in charge (PIC), so the tenant knows who is handling it and by when. For prospective tenants, the LOI (letter of intent) can be signed online, which shortens the path from offer to contract.

Figure 2. A tenant follows invoices and complaint tickets through a phone portal with no extra licence.
For technical teams: from complaint to measurable work order
On the technical side, a tenant complaint automatically becomes a work order, so no request is lost in a messaging thread. Response and repair times are tracked against the SLA, and overdue jobs appear on the dashboard. For managers, this turns the question "has it been handled?" into data that can be seen at any time.
Routine maintenance, recording of materials and labour hours, and the service life of components such as lamps, filters and batteries are managed in the same system. Maintenance cost per building can therefore be traced, and replacements planned before failure. Technicians also read electricity and water meters on their rounds from a phone, with photos and an alert when a figure looks abnormal. Verified meter readings flow into the invoice, so utility billing no longer depends on retyping.
Floor plans and BIM models in the browser
AutoCAD floor plans (DXF) and Revit models (IFC) open directly in the browser. Spaces are coloured by status, and one click on a space shows its tenant, contract or equipment, such as lifts, chillers and generators. This approach is consistent with BIM practice for facility management, which links the building model to operational data.
Office verification as an internal control
Every field input is verified by office staff before it enters an invoice or closes a work order. This is an important internal control: technicians record the facts on site, while office staff confirm the data is fit before it affects billing. Separating these roles reduces the risk of billing errors and leaves a clear audit trail.

Figure 3. Engineers read meters and inspect equipment supported by a colour-coded floor plan on a tablet.
Leasing and finance: from prospect pipeline to automated billing
The leasing and finance functions manage the entire revenue cycle, from prospective tenant to settled invoice. The prospect pipeline shows opportunities in progress. Lease contracts support rent escalation and rent-free periods, the free-rent months commonly granted at the start of a lease. For short-term occupiers such as kiosks and atrium events, casual leasing is available.
Monthly billing runs automatically and covers rent, service charge, utilities, turnover rent, penalties, deposits and PPh 4(2), the Indonesian final income tax on rental income. For arrears, warning letters SP1 to SP3 are managed in the same workflow, so collection follows a consistent, documented procedure. When contract, meter and sales data sit in one system, invoices are calculated from a single source rather than from copies.
| Stage | What the system handles | Benefit for leadership |
|---|---|---|
| Prospecting | Prospect pipeline, online LOI | Visibility of space-filling opportunities |
| Contracting | Escalation, rent-free, casual leasing | Contracted revenue is not missed |
| Billing | Rent, service charge, utilities, turnover rent, PPh 4(2) | Consistent, timely invoices |
| Follow-up collection | Penalties, SP1 to SP3, deposits | Lower risk of bad receivables |
User roles and guidance: the key to real adoption
A system is only valuable if it is used consistently, and that depends on clear roles. Five roles are available: Board of Directors, Leasing, Finance and Collection, Engineering and Facilities, and Property Manager. Each sees the menus relevant to their work, so screens are not crowded with features they do not need. Every menu has a user guide in plain language, and the whole interface is available in three languages.

Figure 4. Directors and cross-functional managers read the same dashboard in a performance review meeting.
A decision framework for moving away from Excel
The safest transition is phased, starting with one pilot building. Leaders can use the following framework to judge readiness and sequence the work.
- Map the most disputed numbers. Agree on definitions of occupancy, rent roll and arrears that every department accepts.
- Choose a pilot building. Select one asset with enough tenant variety to test every workflow.
- Migrate contract data first. Clean contracts are the foundation of automated billing and the dashboard.
- Activate the tenant portal and meter reading. Start with a small group, then expand.
- Set verification rules. Decide who verifies field input and within what time.
- Evaluate with fixed indicators. Compare collection rate, work-order completion time and book-closing time before and after.
From an investment viewpoint, leaders should assess the benefit by comparing the time now spent compiling manual reports with the time available for analysis and action. A company can measure these figures itself before and after implementation. Leaders should also recognise the limits: a good system does not replace process discipline. The quality of starting data, the clarity of policy and the commitment of each department still determine the result.
Conclusion
Odoo building management unites leasing, billing, technical operations and board reporting in one application, so decisions are made from the same current data. The board gains portfolio visibility without waiting for roll-ups, tenants receive transparent service, and technical teams work to measurable deadlines with clear verification. A realistic next step is to select a pilot building and agree on the definitions of the key indicators with all departments. From there, the value of the investment can be measured through collection rate, complaint handling speed and the time needed to prepare reports.
Choosing a platform for the long term also means choosing the company behind it. According to the official Odoo company profile, Odoo is used by more than 28 million users worldwide, supported by more than 8,000 employees, a network of more than 21,000 partners, about 50 main applications that are upgraded regularly, and offices in 14 countries. These figures matter to a property group for one practical reason: a platform of this scale keeps evolving, keeps attracting implementation expertise, and is unlikely to leave your portfolio stranded on an abandoned system.
| Odoo milestone (2026) | Figure | What it means for a property group |
|---|---|---|
| Users worldwide | More than 28 million | A proven platform with a very large user base |
| Employees | More than 8,000 | Sustained product development and support |
| Partner network | More than 21,000 partners | Implementation expertise available locally |
| Main applications | About 50, regularly upgraded | Leasing, accounting, maintenance and portal on one platform |
| Offices | 17 locations in 14 countries | A global company with regional presence |
Source: the official Odoo company profile at odoo.com, as referenced in November 2026.
PT Fujicon Priangan Perdana is an ERP implementation consultant in Indonesia that supports companies in turning Odoo into a daily working tool. For property groups, we begin with a conversation about your portfolio, then map your leasing, billing and engineering processes, and propose a phased plan that starts with one pilot building.
- Business needs consultation and a walkthrough of the building management solution
- Analysis of leasing, billing and engineering processes against Odoo workflows
- Implementation from data migration to go-live, including tenant portal and field meter reading
- User training with plain-language guides for each role
- Post-implementation support and customisation for your property type
Contact our team to schedule a discussion and a demonstration.
WhatsApp: +6281122275222
Website: www.fujicon-japan.com