

Key Takeaway: High WIP (work in progress) means materials, semi-finished goods, or project work have been started but not finished, and are accumulating. It rarely stands alone. It is usually a symptom of a process constraint such as a bottleneck, poorly synchronized scheduling, late materials, rework, or stalled approvals. An ERP such as Odoo helps detect it earlier because it records work flow, time, materials, and cost in one integrated dataset, so management can act before cash flow and delivery schedules are affected.
Many managers read high WIP as a sign that operations are busy. In practice, accumulating work in progress is more often a symptom that work flow is stalling at a specific point. For executives and senior managers, the important question is not how large the WIP value is today, but why it is rising and how quickly its cause can be identified. This article explains what high WIP means for business performance, the process root causes behind it, and how an ERP such as Odoo helps management detect it earlier and respond in a measurable way.
1. What High WIP Means for Business Performance
High WIP is a condition in which work in progress far exceeds what is needed to keep work flowing smoothly. In manufacturing companies, WIP consists of raw materials already released to production and semi-finished goods. In project-based businesses such as construction, installation, or multimedia production, WIP is work that has consumed cost and labor hours but is not yet complete or not yet billable.
The relationship between WIP, output, and time is described by Little's Law: average WIP equals the average output rate multiplied by the average cycle time. If output remains fairly stable while WIP rises, cycle time must be lengthening. Put differently, each unit of work spends more time waiting than being worked on. This is why elevated WIP almost always indicates an unhealthy queue somewhere in the process.
For executives, rising WIP affects four areas. First, working capital is tied up in work that has not yet generated cash. Second, lead times lengthen, making delivery commitments harder to keep. Third, the risk of damage, obsolescence, and rework increases the longer goods or work items wait. Fourth, visibility declines, because more work sits in an almost finished state with no certainty about when it will actually be completed.
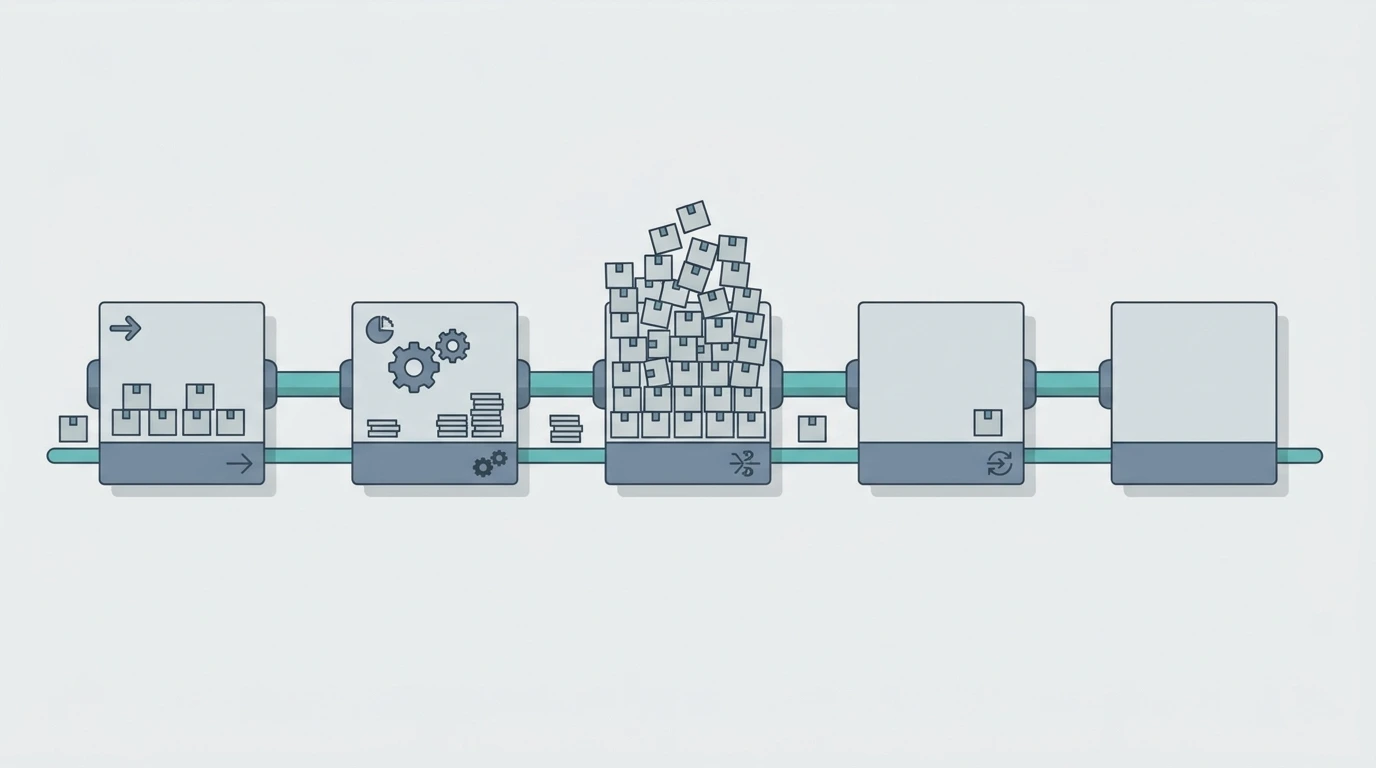
A simple production flow showing work piling up at one stage.
2. Five Process Root Causes Behind Accumulating WIP
WIP accumulates because work flow is obstructed at a specific point, and that obstruction usually comes from one of the five groups of process problems below.
| Root cause | Symptoms on the floor | Business impact |
|---|---|---|
| Bottleneck at one station or work center | Long queue before one machine or team while other stations wait | Longer lead time, wasted capacity elsewhere |
| Planning and scheduling out of sync | Orders released to production faster than they can be completed | Large amounts of unfinished work, shifting priorities |
| Late or incomplete materials and components | Work stops because one component has not arrived | Orders stuck, capital tied up, delivery dates slip |
| Quality defects and rework | Goods return to earlier stages, inspections pile up | Higher cost, capacity consumed by repeated work |
| Delayed approvals and documents | Work is physically complete but waits for sign-off or handover documents | Delayed billing, cash flow held back |
These five causes often appear together and reinforce one another. An undetected bottleneck pushes planners to release orders early to keep other machines busy, which lengthens the queue in front of the bottleneck. Poor quality adds rework that consumes capacity at the same constrained point. For this reason, reducing WIP by simply telling teams to work faster, without finding the root cause, almost always fails. Oversized production batches and uncoordinated handoffs between stations make matters worse, because work waits longer before moving to the next stage.
3. Why High WIP Is Often Noticed Too Late
High WIP is often noticed too late because the data describing it is scattered across many places and is consolidated only after the period ends. In many companies, production measures output, the warehouse measures stock, and finance measures value. No single function routinely measures flow, even though flow is what reveals where work is stuck.
- Fragmented data. Work status is kept in departmental spreadsheets, daily reports in messaging apps, and manual notes on the floor, so a complete picture emerges only through manual reconciliation.
- Outcome metrics instead of flow metrics. Reports that highlight the number of finished items do not show how long items waited or where queues formed.
- Reporting delay. WIP value usually appears only as an aggregate figure on the month-end balance sheet, without an explanation of the cause, so corrective action arrives one or two periods late.
4. How Odoo ERP Detects High WIP Early
Odoo ERP helps detect high WIP earlier because it records work flow, time, materials, and cost in a single database, so symptoms become visible at the operational level before they turn into figures in financial reports.
In the Manufacturing module, each manufacturing order has a status and can be broken into work orders per work center, with planned and actual durations. The Inventory module records movements of materials and semi-finished goods between locations. The Quality and Maintenance modules show quality checks and machine downtime. The Accounting module adds the inventory valuation side. For project-based businesses, the Project, Timesheet, and Sales modules show hours worked and progress against contract value that has or has not been billed.
| Odoo module | Data recorded | WIP signal it reveals |
|---|---|---|
| Manufacturing | Manufacturing orders, work orders, planned and actual duration per work center | Queues at a specific work center, orders that stay in progress for too long |
| Inventory | Movements of materials, components, and semi-finished goods | Components not yet available, goods lingering in production locations |
| Quality and Maintenance | Quality checks, maintenance requests, machine downtime | Spikes in rework, machines that stop frequently |
| Project and Timesheet | Tasks, hours worked, project progress | Projects with running cost but stagnant progress |
| Sales and Accounting | Contract value, billing, inventory valuation | Completed work not yet billed, WIP value rising against sales |
Note that the availability of features and reports depends on the Odoo version, edition, and the modules that are activated. The quality of the signal is also determined by the tidiness of master data, such as the bill of materials, routings, and work center definitions. Without realistic master data, an ERP will simply display figures that do not reflect conditions on the floor.
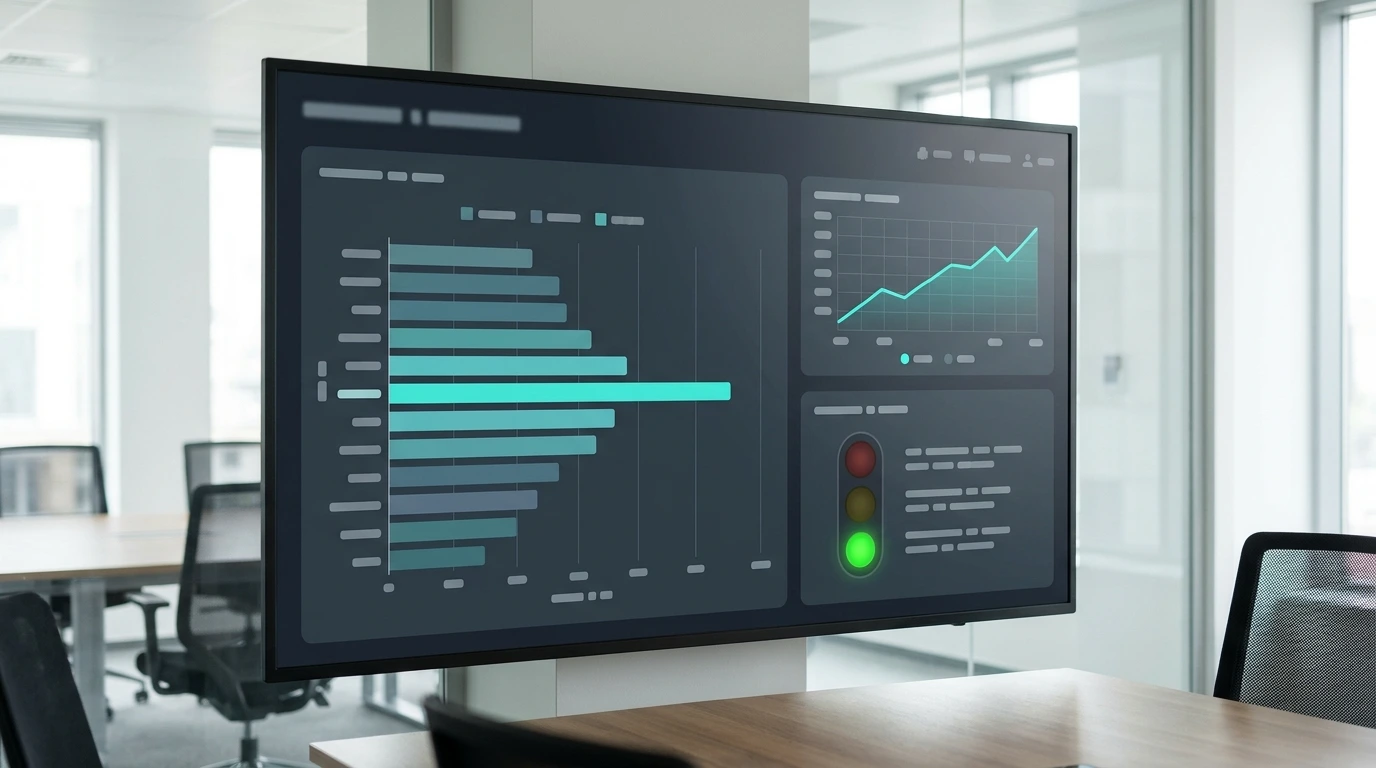
Production monitoring panel showing job queues per workstation.
5. Early Indicators Management Should Monitor
Management needs only six flow indicators to know whether WIP is starting to move in an unhealthy direction. These indicators can be built from transaction data that already exists in the ERP.
| Indicator | What it shows | Question for management |
|---|---|---|
| WIP aging | How long orders have been in process | Which orders exceed a reasonable age, and why? |
| Queue per work center | Where work is waiting | Are queues concentrated at one point? |
| Ratio of waiting time to processing time | How much of the cycle time is lost to waiting | Is the ratio worsening from period to period? |
| Rework and scrap rate | Capacity burden caused by quality problems | Which stage most often sends work back? |
| Orders behind schedule | Accuracy of planning and execution | Do delays follow a pattern by product or customer? |
| WIP value relative to sales or billing | Working capital efficiency | Is WIP growing faster than sales? |
There is no universal threshold that applies to every industry. Use your own performance in a stable period as the benchmark, then watch trends and patterns rather than a single number. A consistent increase across several indicators at once is a far stronger signal than daily fluctuation in one of them.
6. Illustration: When WIP Rises but Sales Stay Flat
The following example is illustrative and does not represent any specific company. Imagine a metal component fabricator whose orders have been stable for several quarters. Financial reports show WIP value rising for three consecutive months, yet the plant looks busy and the shop floor raises no major complaints.
When production data in the ERP is traced by work center, queues turn out to be piling up at the welding stage while the cutting stage keeps releasing parts downstream. Actual welding durations are consistently longer than planned, partly because of rework caused by inconsistent cutting tolerances. Scheduling still follows order dates without accounting for welding capacity. The root cause is not a general shortage of labor but a combination of a bottleneck, upstream quality, and unrestricted order release. Without flow data per work center, a finding like this usually surfaces only after deliveries begin to slip.
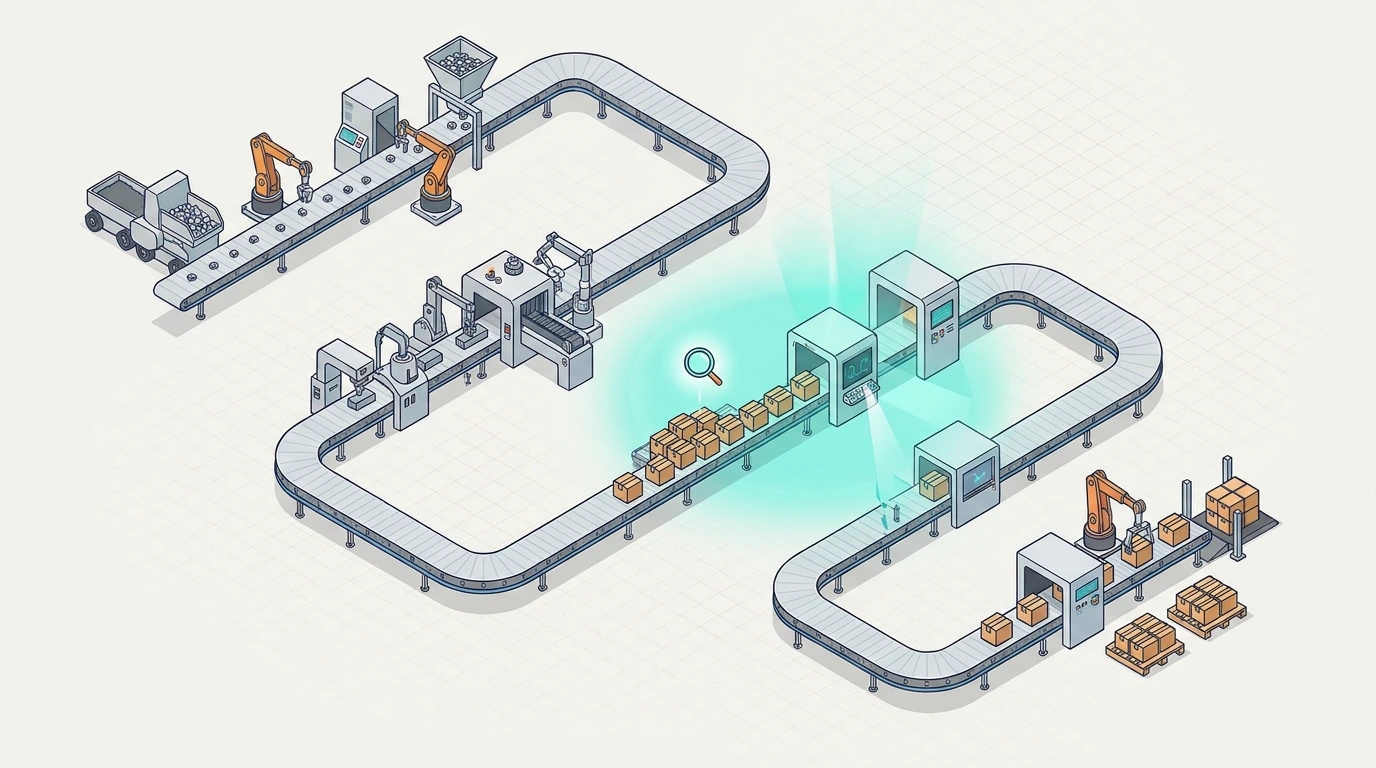
Production line with queue in third stage highlighted for early detection.
7. A Decision Framework: From Signal to Action
Early detection is valuable only when it is followed by structured decisions. The framework below helps management turn a WIP signal into accountable action.
- Confirm the signal. Make sure the rise in WIP is real and not caused by unrecorded data or statuses that have not been updated.
- Locate the constraint. Trace queues and WIP aging by work center or project stage to find where the obstruction sits.
- Classify the dominant cause. Determine whether the problem is capacity, scheduling, materials, quality, or approvals.
- Choose an action and assign an owner. Every action has a responsible person, a deadline, and a measure of success.
- Re-measure. Track the same indicators in the next period to confirm that the action actually reduced the queue.
| Dominant cause | Management action | Suggested owner |
|---|---|---|
| Bottleneck | Limit order release, reschedule, evaluate added capacity at the constraint | Head of production and planner |
| Scheduling out of sync | Align order release dates with real capacity | Production planner |
| Late materials | Improve reorder rules and review supplier performance | Head of procurement |
| Quality and rework | Trace defect sources upstream, strengthen inspection at critical points | Head of quality |
| Delayed approvals | Set approval time limits and automatic escalation | Project manager and finance |
8. A Phased Implementation Approach
Implementing WIP monitoring in an ERP is best done in phases, so that the data it produces can be trusted before it becomes the basis for decisions.
| Phase | Focus | Expected result |
|---|---|---|
| 1. Clean up master data | Bill of materials, routings, work centers, and realistic standard durations | Plans that can be compared with actual conditions |
| 2. Recording discipline | Timely recording of status, time, and material consumption on the floor | Accurate, near real-time flow data |
| 3. Dashboards and review rhythm | Flow indicators reviewed regularly in operations meetings | Early signals are read and acted on routinely |
| 4. Continuous optimization | Adjusting capacity, batch size, and order release rules | Shorter cycle times and better-controlled WIP |
Start with the single production line or project group that is most problematic, then expand once recording practices and the review rhythm have proven to work. This approach limits the risk of large-scale change while producing evidence of value that can be shown to other teams.
9. Risks and Governance to Anticipate
An ERP does not automatically solve WIP problems, and several governance risks should be anticipated from the start.
- Recording discipline. Late or incomplete data produces misleading signals. Assign clear recording responsibility at every stage.
- Unrealistic routings and durations. Overly optimistic time standards make all work look late and weaken the team's trust in reports.
- Metrics turned into a single target. If teams are judged only on WIP reduction, they may delay recording or move work around administratively. Use several indicators together.
- Low WIP is not an absolute goal. Some buffer WIP is needed to keep flow smooth. The aim is healthy WIP appropriate to the business context, not zero WIP.
- Data access and confidentiality. Production and cost data are sensitive. Set role-based access rights and apply ethical handling of internal data.
10. Conclusion
High WIP deserves to be treated as a management signal, not merely a figure on the balance sheet. It shows that work is waiting longer than it should, and the cause almost always lies in the process: bottlenecks, scheduling, materials, quality, or approvals. The strategic value of an ERP such as Odoo lies in its ability to unify flow, time, material, and cost data so that symptoms become visible at the operational level rather than only in the month-end report.
A realistic next step is to select one line or project group to monitor, clean up its master data, and set a review rhythm for flow indicators with operations and finance teams. With a phased approach, management can reduce the risk of tied-up working capital, shorten lead times, and keep promises to customers.
Would you like to assess the readiness of your processes and data for Odoo-based WIP monitoring? The Fujicon team is ready to discuss your needs and an implementation path that fits your company's conditions. WhatsApp: +6281122275222 | Website: www.fujicon-japan.com